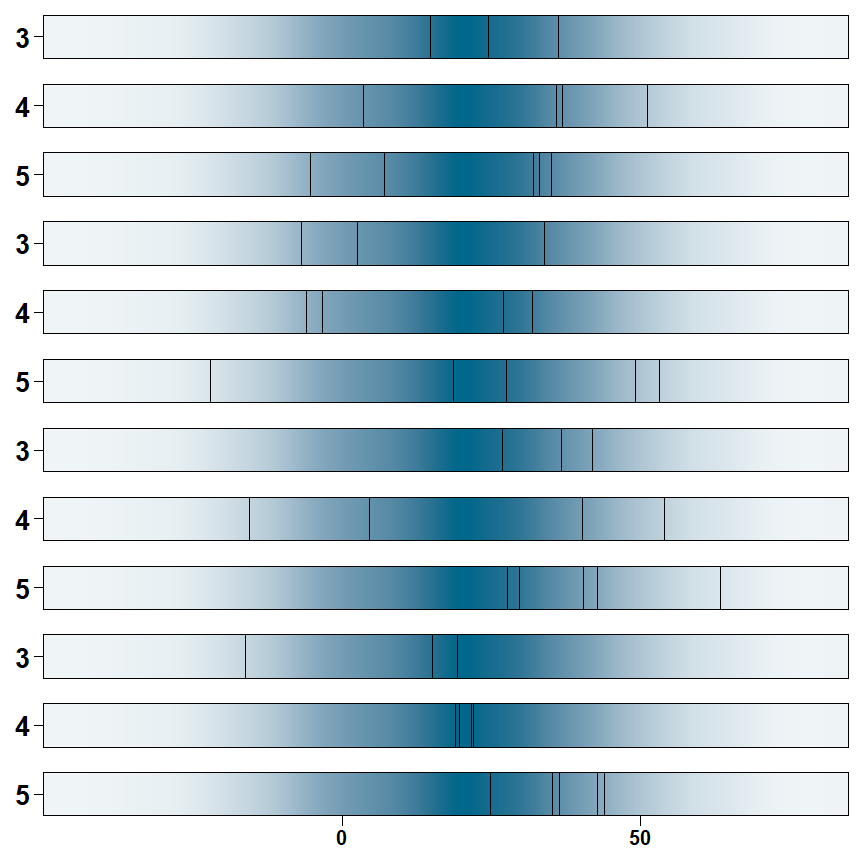
Shwo how to ggplot2 using stat_density
使用geom_raster来画这张图
Reference: https://ggplot2.tidyverse.org/reference/geom_tile.html
library(tidyverse)
## ── Attaching core tidyverse packages ──────────────────────── tidyverse 2.0.0 ──
## ✔ dplyr     1.1.2     ✔ readr     2.1.5
## ✔ forcats   1.0.0     ✔ stringr   1.5.1
## ✔ ggplot2   3.4.3     ✔ tibble    3.2.1
## ✔ lubridate 1.9.2     ✔ tidyr     1.3.0
## ✔ purrr     1.0.2
## ── Conflicts ────────────────────────────────────────── tidyverse_conflicts() ──
## ✖ dplyr::filter() masks stats::filter()
## ✖ dplyr::lag()    masks stats::lag()
## ℹ Use the conflicted package (<http://conflicted.r-lib.org/>) to force all conflicts to become errors
genes_plot <- c(rep(c(3, 4, 5), 4))

data <- rnorm(n = 3000, mean = 20, sd = 20) %>%
  data.frame() %>% set_names("log2fc")

p <- lapply(genes_plot, function(x) {
  ggplot(data, aes(log2fc, factor(1))) +
    stat_density(aes(fill = after_stat(count)), geom = "raster", position = "identity") +
    scale_fill_gradient(low = colorRampPalette(c("white", "deepskyblue4"))(50)[4], high = "deepskyblue4") +
    geom_rect(data = data %>%
                rownames_to_column("Rank") %>%
                filter(Rank %in% sample(1:1000, x)),
              aes(xmin=log2fc, xmax=log2fc, ymin=-Inf, ymax=Inf),
              color="black", alpha = 0.5) +
    scale_x_continuous(expand = c(0, 0)) +
    scale_y_discrete(expand = c(0, 0), name = x) +
    ggthemes::theme_base() +
    xlab(NULL) +
    theme(legend.position = "none",
          axis.title.y = element_text(size = 20, face = "bold", angle = 0, vjust = 0.5, hjust = 0),
          # axis.ticks.y = element_blank(),
          axis.text.y = element_blank(),
          plot.background = element_blank(),
          axis.ticks.x = element_blank(),
          axis.text.x = element_blank())
})

p[[length(genes_plot)]] <-
  ggplot(data , aes(log2fc, factor(1))) +
  stat_density(aes(fill = after_stat(count)), geom = "raster", position = "identity") +
  scale_fill_gradient(low = colorRampPalette(c("white", "deepskyblue4"))(50)[4], high = "deepskyblue4") +
  geom_rect(data = data %>%
                rownames_to_column("Rank") %>%
                filter(Rank %in% sample(1:1000, last(genes_plot))),
            aes(xmin=log2fc, xmax=log2fc, ymin=-Inf, ymax=Inf), color="black", alpha = 0.5) +
  scale_x_continuous(expand = c(0, 0)) +
  scale_y_discrete(expand = c(0, 0), name = genes_plot %>% last()) +
  ggthemes::theme_base() + xlab(NULL) +
  theme(legend.position = "none",
        axis.title.y = element_text(size = 20, face = "bold", angle = 0, vjust = 0.5, hjust = 0),
        # axis.ticks.y = element_blank(),
        axis.text.y = element_blank(),
        axis.text.x = element_text(size = 15, face = "bold"),
        plot.background = element_blank())

patchwork::wrap_plots(p , ncol = 1)