layout: post title: 复刻一篇文章里面的图片 subtitle: 一息尚存,此志不容少懈。 date: 2021-05-24 author: Chevy header-img: img/42.png catalog: true tags:
- 技术学习笔记 style: plain —
原文图片
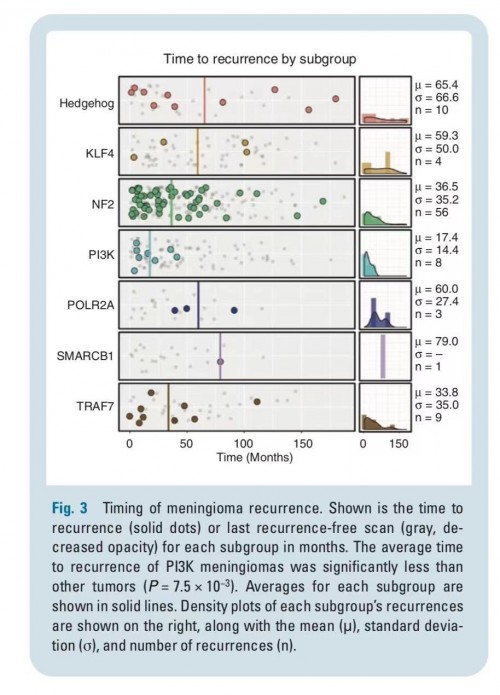
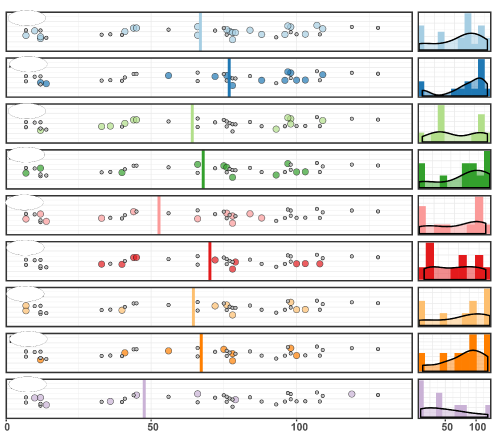
复刻图片
已对敏感信息进行处理:
附上代码
xl_data <- "mutation type.xlsx"
tab_names <- excel_sheets(path = xl_data)
list_all <- lapply(tab_names, function(x) read_excel(path = xl_data, sheet = x) %>% mutate(Tumor_Sample_Barcode = x))
df <- rbind.fill(list_all)
head(df)

os <- read_delim(file = "overall_survival.txt", delim = "\t")
os$jitter <- rnorm(nrow(os), mean = 1, sd = 0.2)


plot_dot <- function(name, n) {

  barcode = df %>% filter(gene == name) %>% select(Tumor_Sample_Barcode) %>% unique()

p1 <- ggplot(os[os$Pathological_number %in% barcode$Tumor_Sample_Barcode,], aes(x = Progression_time,  y = jitter)) +
  geom_point(shape = 21,size = 4, color = "black", fill = RColorBrewer::brewer.pal(n = 9, name = "Paired")[n], alpha = 0.7) +
  geom_point(data = os[!os$Pathological_number %in% barcode$Tumor_Sample_Barcode,],
             aes(x = Progression_time, y = jitter), shape = 21, fill = "grey", size = 2) +
  geom_vline(xintercept = mean(os[os$Pathological_number %in% barcode$Tumor_Sample_Barcode,]$Progression_time),
             size = 2, color = RColorBrewer::brewer.pal(n = 9, name = "Paired")[n]) +
  scale_x_continuous(expand = c(0, 0), limits = c(0, 140)) +
  scale_y_continuous(expand = c(0, 0), limits = c(0, 2)) +
  theme_bw(base_rect_size = 2) +
  theme(axis.title = element_blank(),
        axis.ticks = element_blank(),
        axis.text = element_blank())

p2 <- ggplot(os[os$Pathological_number %in% barcode$Tumor_Sample_Barcode,], aes(x = Progression_time)) +
  geom_histogram(aes(y = ..density..), binwidth = 10,
                 fill = RColorBrewer::brewer.pal(n = 9, name = "Paired")[n]) +
  geom_density(fill = RColorBrewer::brewer.pal(n = 9, name = "Paired")[n],
               alpha = 0.5, size = 1, outline.type = "full") +
  scale_x_continuous(expand = c(0, 0)) +
  theme_bw(base_rect_size = 2) +
  theme(axis.title = element_blank(),
        axis.ticks = element_blank(),
        axis.text = element_blank())

  plot_grid(p1, p2, rel_widths = c(10,2), labels = name)
}
